
David Stockman
David Stockman
In the 1980’s Ronald Reagan ushered in a new era in American economics as he cut the top tax bracket from 70% down to 50% and then down again to 28%. In order to get support for doing this from the people, and also from politicians, a very crafty set of lies were produced. As David Stockman, then Reagan’s budget director, put it: giving small tax cuts across the board to all brackets was simply a “Trojan Horse” that was used to get approval for the huge top tax bracket cuts. “Trickle-Down” was a term used by Republicans that meant giving tax cuts to the rich. Stockman explains that:
"It's kind of hard to sell 'trickle down,' so the supply-side formula was the only way to get a tax policy that was really 'trickle down.' Supply-side is 'trickle-down' theory."
"Yes, Stockman conceded, when one stripped away the new rhetoric emphasizing across-the-board cuts, the supply-side theory was really new clothes for the unpopular doctrine of the old Republican orthodoxy."
"…the Reagan coalition prevailed again in the House and Congress passed the tax-cut legislation with a final frenzy of trading and bargaining. Again, Stockman was not exhilarated by the victory. On the contrary, it seemed to leave a bad taste in his mouth, as though the democratic process had finally succeeded in shocking him by its intensity and its greed. Once again, Stockman participated in the trading -- special tax concessions for oil -- lease holders and real-estate tax shelters, and generous loopholes that virtually eliminated the corporate income tax. Stockman sat in the room and saw it happen."
"'Do you realize the greed that came to the forefront?' Stockman asked with wonder. 'The hogs were really feeding. The greed level, the level of opportunism, just got out of control.'"
The Education of David Stockman 1981:
http://www. theatlantic. com/politics/budget/stockman.htm
Reagan's policies did more than simply cut income taxes. A large number of tax loopholes were written into the tax code that catered to special corporate interests. In fact many of the current scandals involving companies such as Enron are rooted in laws that were passed during the Reagan administration that gave these companies more legal legroom to work with and less oversight.
In addition, the small “income-tax cuts” that were given to the middle and lower income tax brackets were countered with new taxes that were directed at middle and low income individuals, as former House Speaker Jim Wright said:
Reagan's tax increases fell mainly on consumers, low- and middle-income people. Sales and excise levies. Reagan didn't call these taxes. They were, in his euphemistic lexicon, "user fees" and "revenue-enhancers."
The most important issue though is that even if you take the Reagan “Trickle-Down” policy at face value it’s still horribly flawed as a policy that will provide economic growth that benefits all Americans.
There is no realistic way for "Trickle-Down" economics to work to increase the income of the working classes of America. In fact I am certain that the developers of the theory of "Trickle-Down" economics were fully aware of this and that "Trickle-Down" has in fact worked as intended. This means that the intent behind implementing "Trickle-Down" was to benefit the wealthiest Americans at the expense of working class Americans. "Trickle-Down" hasn't failed, as many modern economists have suggested, it has succeeded in its goals, which is the increase of economic inequality and the shift of a greater portion of America's wealth into the hands of the wealthiest Americans.
I'll show you exactly why "Trickle-Down" can never really trickle down, and I'll expose the logic that was used to trick Americans into supporting the idea that freeing up money for the wealthy could somehow benefit the poor and middle class.
I'm going to use a very simplistic example to demonstrate the principles of "Trickle-Down" economics. No, this is not a 100% accurate model of our economic system, and it assumes that "all other aspects of the economy are equal," but the major principles are represented. I will give "Trickle-Down" the benefit of the doubt and assume that it actually does create jobs in my example.
We have a room with 5 people in it. The total value of all the money in the room is $10. 00. The money is apportioned as in the table below.
|
Total Value $10. 00 |
||
|
Jim |
$4. 00 |
40% |
|
Susan |
$3. 00 |
30% |
|
Tom |
$2. 00 |
20% |
|
Amy |
$1. 00 |
10% |
|
Bill |
$0. 00 |
0% |
Sam enters the room and says that he has $10. 00 that he wants to give to Jim. This makes everyone else unhappy of course and everyone says that they will beat Jim up if he takes the money. Sam then proposes a solution. He says that if everyone allows him to give Jim $6. 00 he will give $1. 00 to everyone else in the room. This sounds pretty good to everyone so they agree to let Jim receive the money. So, after Jim gets the money and everyone gets a dollar this is what the monetary breakdown of the room looks like:
|
Total Value $20. 00 |
||
|
Jim |
$10. 00 |
50% |
|
Susan |
$4. 00 |
20% |
|
Tom |
$3. 00 |
15% |
|
Amy |
$2. 00 |
10% |
|
Bill |
$1. 00 |
5% |
As you can see, due to inflation most of the other people in the room either lost value or saw no real gain. As you can also see the size of the "economy" did in fact grow as the theory of "Trickle-Down" proposes, but the growth only benefited one person, Jim, and arguably Bill. Even though the economy grew overall most of the people in the room saw a loss of value. This is because the value of money is relative. It's relative to many factors, but one is how much money is in the system. If you have 1 dollar out of 10 then its worth more than 1 dollar out of 1,000. How wealthy you are in terms of dollars is not measured by the number of dollars you have, it is measured by the share of dollars that you have out of the total number of dollars in the system.
Now, your opinion of Sam and Jim can be one of only two options.
1) Jim and Sam were naive and actually thought that they were going to be helping everyone with their actions; the fact that the actions had a negative effect on everyone else was an accident.
2) Jim and Sam knew that taking the $10. 00, keeping $6. 00 of it, and giving $1. 00 to everyone else wasn't going to help anyone but Jim, and they tricked everyone for the purpose of self gain using the $1. 00 "gift" to the under-classes as a "Trojan Horse" to support the action.
As in the example above there are three basic possibilities for economic growth (and many variations in between): Either the growth of the economy can be spread equally among everyone, the growth of the economy can be shifted towards the bottom of the population in which case the poor see a rise in relative value, becoming "less poor," or the growth can be shifted toward the top in which case the rich see a rise in relative value, becoming "more rich. "
The general economic policy of "Trickle-Down" that was put in place by Reagan has gone fundamentally unchanged since it was adopted by the country in the 1980s. The claim of Reagan was that "all boats would rise" by giving huge tax cuts for the wealthy. This did not happen. The majority of boats stayed the same or sank, while only between 5% and 1% of the boats actually rose.
The effects of "Trickle-Down" policy are evident. As would be expected from the policy, the largest beneficiaries of the "Trickle-Down" system have been the wealthy.
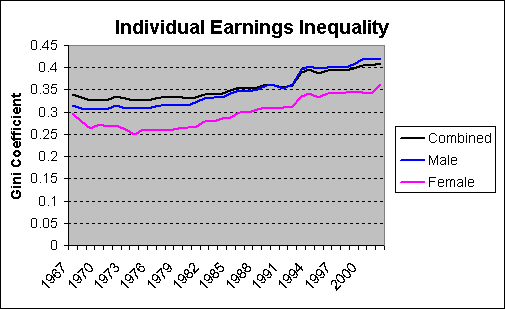
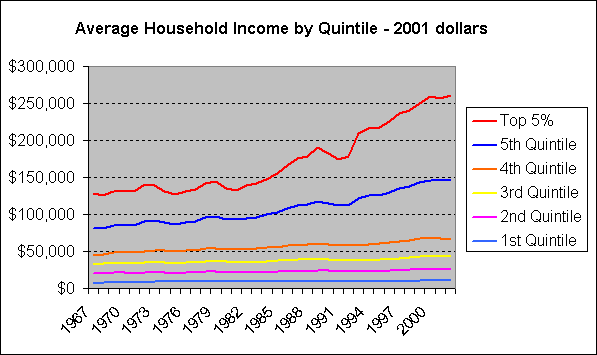
Individual earnings inequality as reported by the U. S. Census Bureau was falling or stable from the 1960s through the 1970s, however, beginning in the 1980s, along with the economic reforms of "Trickle-Down" policy, income inequality began to rise and has continued to rise dramatically ever since, as shown in the figure below.
(Data for the graphs below comes from the US Census Bureau)
http://www. census. gov/hhes/income/histinc/histinctb.html
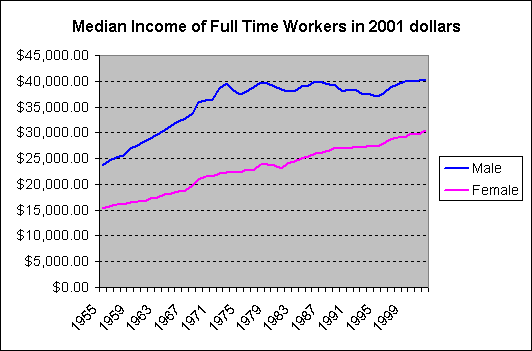
Although there was a huge increase in real income for average Americans between World War II and the 1970s the income of the average American male has gone essentially unchanged since 1970 as the figure below indicates. Income for females though has continued to rise. What is significant about this graph is that between 1980 and present (2003) the incomes of the top 2% of American wage earners has gone up dramatically despite the stagnation of the income of average Americans.
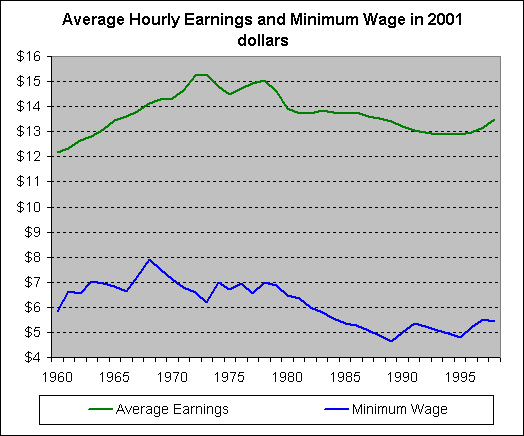
This graph shows both average hourly earnings and the minimum wage together in 2001 dollars. As you can see both the minimum wage and average hourly earnings reached their peak in the 1960s and 1970s. This graph does not go back any farther than 1960, but for all practical purposes the peak shown here in 1973 is the historical peak for hourly earnings in America. See the source data in the link below for details on hourly earnings.
http://w3. access. gpo. gov/usbudget/fy2000/sheets/b047. xls
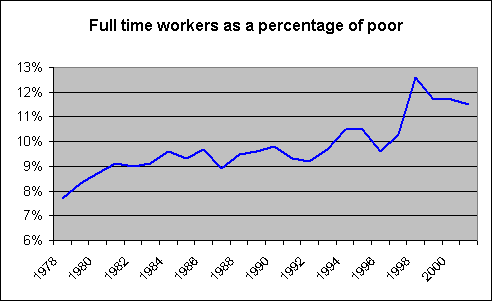
As we can see below, the percentage of people in poverty who are also working full time has gone up steadily since the 1970s, and it also underscores an important point, as all of these graphs do, which is that the fundamental economic policy of the Reagan administration has gone essentially unchanged, even by President Clinton.
http://www. census. gov/hhes/poverty/histpov/hstpov18.html
Today we are still operating under a Supply Side economic model. In fact, even though the average income tax rate paid in America today is roughly the same as it was in 1979, the average income tax rate for the top 1% is less than it was in 1979. The graph below shows the actual percentage of income paid to all (Income, Social Security, Corporate, Capital gains, and Excise) Federal taxes per the various groups. During the Regan era, you can see that total Federal taxes on the lowest income groups actually went up. Clinton continued to maintain the Supply Side model that was established under Reagan. By 2000 the Top 1% still maintained significantly lower taxes compared to the pre-Reagan era, but taxes on "upper middle class" earners had increased and taxes on the middle class have stayed about the same as they were just prior to Reagan's entry into office, which is higher than they ever were prior to the 1970s.

http://www. cbo. gov/showdoc.
cfm?index=4514&sequence=3&from=0
As the figures below indicate, the degree of increase in income for the wealthiest Americans has far outpaced the majority of the population, a trend that also started with the Reagan Presidency. A large factor in this increase for the top 2% has been capital gains.
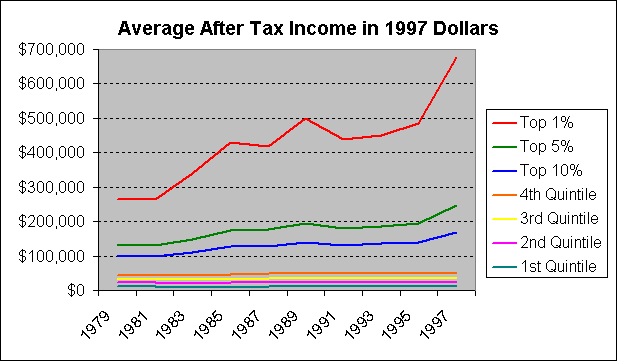
http://www. cbo. gov/showdoc. cfm?index=3089&sequence=11
The two graphs above show similar data, but there are some important differences. Obviously the first graph shows a wider range of data in terms of the years that it covers, but the first graph also shows the data for total household incomes, which have increased among the bottom quintiles in large part because of the increase in two or three worker households, but the bottom graph shows the data adjusted for household size. In addition the bottom graph obviously also shows data for the top 1%, whereas the top graph does not, and, perhaps most significantly, the bottom graph shows after tax income, so it is showing what was taken home after all federal taxes were paid.
This next graph shows an even longer range view. This shows after tax income in 2000 dollars going back to 1913 for the top 1% and the average for the remaining bottom 99%.
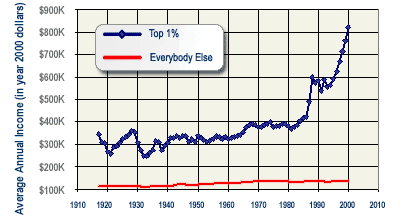
http://www. aflcio. org/corporateamerica/paywatch/
After World War II significant efforts were made to ensure prosperity for all Americans. These efforts dramatically reduced poverty rates and helped to build the strong middle-class that America has become famous for. However, as the graph below shows, significant changes began with the Reagan presidency.
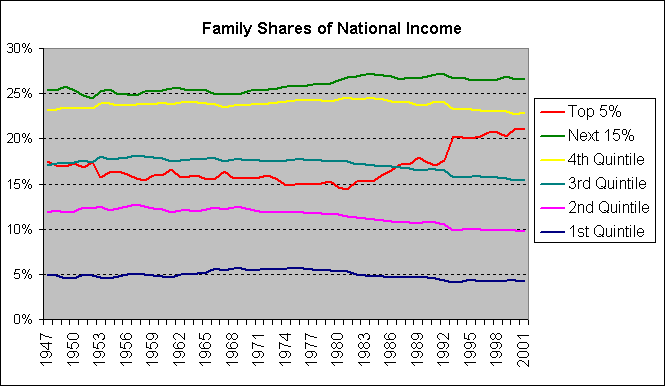
Between 1965 and 2001 the number of multi-worker households has increased dramatically. In fact the slight increase in income that is shown for the 1st through 4th quintiles in the graph titled Average Household Income by Quintile (a quintile represents 1/5th of the population) is primarily attributed to an increase in the number of households with two or more workers supporting the household. Individual male income for the 1st through 4th quintiles has actually gone down or stayed the same since the 1980s when adjusted for inflation.
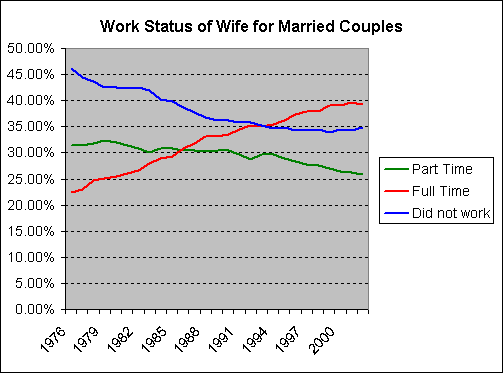
In 1965 27% of the full time workforce was female, by 2001 that number had risen to 41%. What has allowed the average American household to continue to maintain a good standard of living is an increase in multi-worker households and a decrease in the number of children that families have, as well as a large increase in the trade deficit, with increasing numbers of American goods being made in third world countries.
The issue is that the economic policies of the Reagan administration were designed to primarily benefit wealthy Americans. At the time a lot of smoke and mirrors were used to convince average Americans that these policies would help them as well. A similar set of lies has been used by those, like Steve Forbes, who promote a flat tax system.
What the "Trickle-Down"/Supply Side policies of the Reagan administration were designed to do was to increase the amount of money available to wealthy Americans for investing and developing businesses. This was intended to create an increase in production of products and services and hence and increase in new jobs. The reason that the policy is called Supply Side, is because the supply of goods increases before there is a demand for goods. So, in that case, the supply of goods is intended to then spark demand, resulting in economic growth.
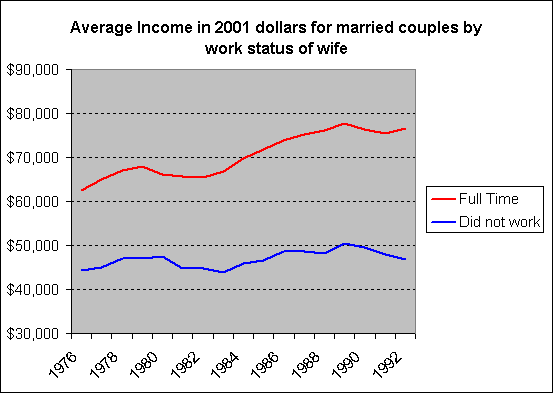
This use of Supply Side policy led to a huge increase in consumerism and the use of credit. An environment of consumerism was created in American society through the media via advertisements, movies, and television shows, etc. that promoted consumerism. Consumers though, did not have the money to fulfill the desires created by society so debt was used to participate in the economy. Restrictions on credit were loosened under the Reagan administration making it easier for individuals to gain credit lines because the use of credit was essential to growing the economy because real wages were not going up for the average American, yet it was essential that the average American increase spending in order to fuel the economy. This situation fueled female entry into the workforce as more households require two workers to maintain their standard of living.
The result of this is that American household debt has been constantly hitting new highs since the 1980s as can be seen in the graph below provided by Michael Hodges.
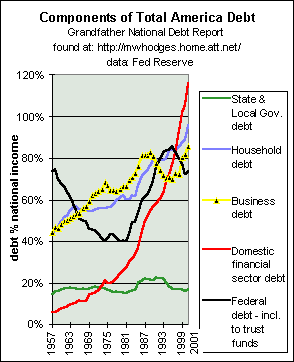
http://mwhodges. home. att. net/nat-debt/debt-nat-a.htm
The truth is that "Trickle-Down" was never intended to help middle income and poor Americans; it was intended to help the wealthy and Corporate America.
The economic policies of the Reagan era increased the trade deficit and provided easier ways for companies to "hide" money.
1980 the top 1% of tax filers received 8. 45% of American AGI (Adjusted Gross Income) and in 2000 that figure had risen to 20. 81% of the national AGI. Today the over 50% of the national income goes to the wealthiest 20% of Americans. This is the first time since 1935 that such a large portion of the national income has gone to such a small portion of the population. In 1967 the wealthiest 20% only accounted for 43% of the nation's income. The trend began in 1982. Between 1967 and 1982 middle-income households were gaining a larger share of the economy. What this means is that between 1982 and 2001 the bottom 80% of Americans have lost share in the nation's economy. This was the inevitable result of Reaganomics. It was an intended result. Political control and economic control go hand in hand. If the control of the economy is not in the hands of the majority of Americans then neither is political control.
For more on taxation and income in America see:
In Depth Analysis of American Income and Taxation
| Previous | Next | Contents |
|
| |||||||||||||||||||
 page views since January 21, 2004